Analyzing my Emacs time over the last 11 years or so
| emacs, quantified, time
My EmacsConf presentation will stream in a few hours, and someone's
probably going to ask where I find the time for all of this. =) So I
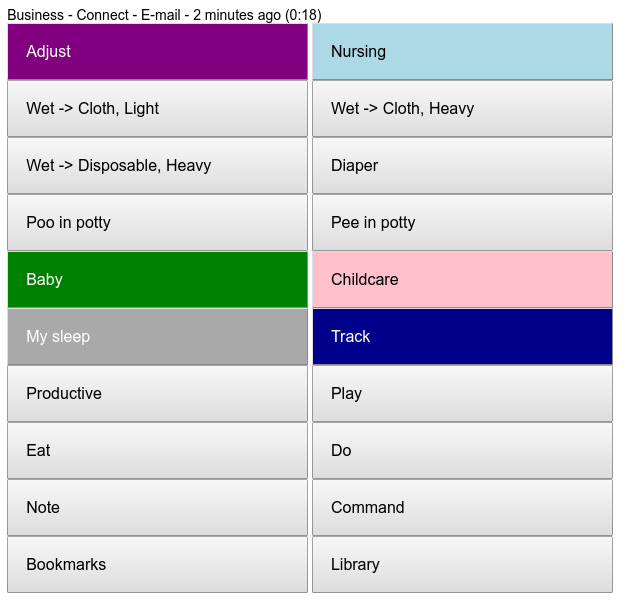
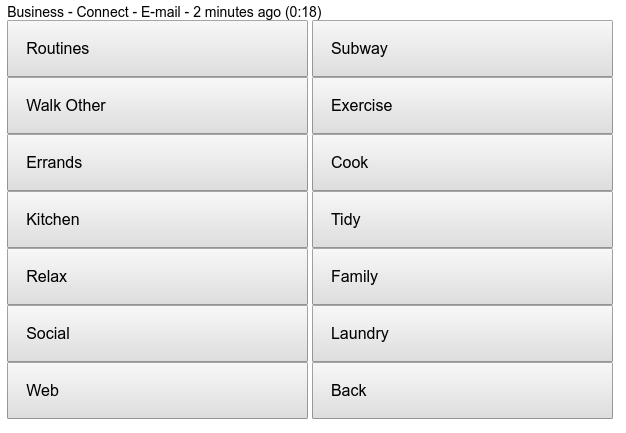
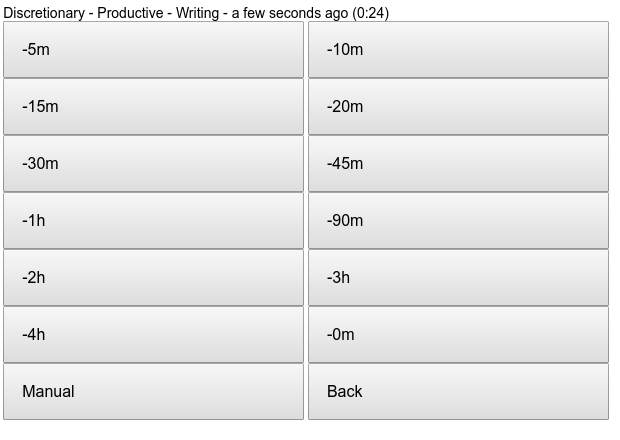
dug through my time logs (a custom system I wrote in 2012 with Ruby on
Rails; has an Emacs interface, of course) and came up with this table
of hours I logged in my Discretionary - Productive - Emacs category
over the past 11 years.
Data for Emacs hours by month by year
| Year | Jan | Feb | March | April | May | June | July | Aug | Sept | Oct | Nov | Dec | Total |
|---|---|---|---|---|---|---|---|---|---|---|---|---|---|
| 2012 | 0.7 | 19.4 | 2.7 | 1.9 | 1.2 | 0 | 0 | 8.6 | 34 | ||||
| 2013 | 0.7 | 12.5 | 38.5 | 18.5 | 10.0 | 6.0 | 1.2 | 5.2 | 0 | 0.1 | 3.2 | 0.4 | 96 |
| 2014 | 2.0 | 3.4 | 18.8 | 39.7 | 45.4 | 15.3 | 2.6 | 0.6 | 2.0 | 7.4 | 5.9 | 15.4 | 158 |
| 2015 | 16.6 | 37.4 | 7.4 | 9.0 | 2.3 | 3.3 | 3.2 | 20.0 | 9.6 | 6.3 | 26.5 | 18.2 | 160 |
| 2016 | 8.6 | 4.6 | 3.7 | 3.7 | 4.2 | 2.9 | 1.4 | 2.9 | 2.7 | 2.2 | 4.3 | 2.4 | 44 |
| 2017 | 3.7 | 2.7 | 3.2 | 3.2 | 3.0 | 2.0 | 5.2 | 2.8 | 0 | 0.9 | 3.4 | 3.8 | 34 |
| 2018 | 2.9 | 3.3 | 1.9 | 2.2 | 3.9 | 3.3 | 0.9 | 1.4 | 1.5 | 1.8 | 2.3 | 3.0 | 28 |
| 2019 | 2.2 | 10.7 | 2.6 | 2.3 | 13.7 | 6.8 | 7.1 | 3.6 | 13.3 | 16.1 | 16.7 | 2.0 | 97 |
| 2020 | 3.3 | 0.5 | 3.0 | .2 | 10.0 | 6.3 | 5.2 | 5.0 | 5.0 | 32.9 | 61.7 | 49.0 | 182 |
| 2021 | 53.7 | 47.1 | 44.7 | 25.5 | 18.1 | 11.5 | 8.3 | 11.9 | 9.5 | 66.0 | 138.1 | 66.6 | 501 |
| 2022 | 13.5 | 13.4 | 3.1 | 3.9 | 7.0 | 4.5 | 4.2 | 5.1 | 45.4 | 157.5 | 146.6 | 95.3 | 500 |
| 2023 | 23.4 | 15.9 | 16.2 | 11.2 | 4.4 | 11.5 | 6.5 | 13.3 | 36.6 | 86.6 | 93.2 | 319 |
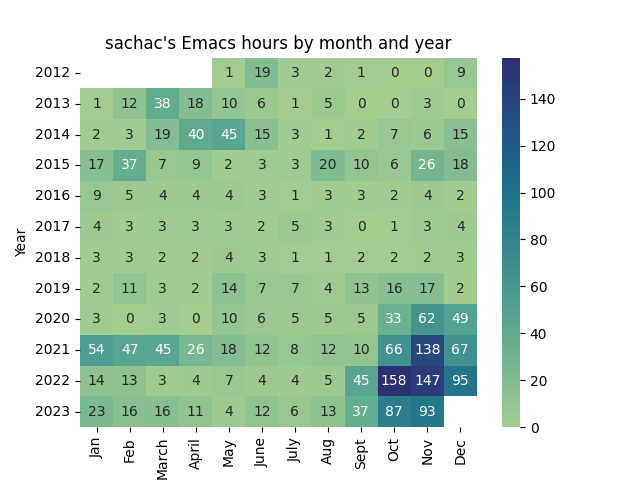
Notes:
- Data collection in this system started in 2012.
- Some months look like they have under-collected data, that's fine.
- Big spike in 2022 was when we decided to go with two tracks for EmacsConf, so I needed to figure out all the infrastructure.
- I started doing Emacs News in 2016, which is maybe 0.5 - 1.5 hours a week.
- EmacsConf restarted in 2019 with an online conference. I've been handling speaker/volunteer coordination, captioning, publishing, and automation/infrastructure.
I can visualize this as a heatmap with:
import numpy as np
import pandas as pd
import matplotlib.pyplot as plt
import seaborn as sns
df = pd.DataFrame(time_data[1:], columns=time_data[0]).drop('Total', axis=1).set_index('Year')
df = df.apply(pd.to_numeric)
plt.title("sachac's Emacs hours by month and year")
plot = sns.heatmap(df, annot=True, cmap='crest', fmt='.0f')
fig = plot.get_figure()
fig.savefig('emacs-time.png')
Yes, I do actually sleep
Overall balance of activities
| Activity | Jan 2023 | Feb 2023 | Mar 2023 | Apr 2023 | May 2023 | Jun 2023 | Jul 2023 | Aug 2023 | Sep 2023 | Oct 2023 | Nov 2023 | Total |
| A- | 39.0% | 47.5% | 44.4% | 44.2% | 44.1% | 44.4% | 41.8% | 40.5% | 33.2% | 33.3% | 34.3% | 40.6% |
| Business | 1.3% | 0.5% | 3.5% | 1.9% | 3.8% | 2.8% | 3.5% | 7.0% | 8.8% | 1.9% | 1.7% | 3.3% |
| Discretionary > | 10.8% | 3.9% | 4.5% | 6.0% | 6.6% | 8.3% | 6.9% | 6.2% | 8.8% | 14.5% | 16.1% | 8.4% |
| Personal > | 10.1% | 10.2% | 11.7% | 10.4% | 9.3% | 8.8% | 9.9% | 8.4% | 9.4% | 10.6% | 11.9% | 10.0% |
| Sleep | 34.6% | 35.4% | 32.9% | 34.9% | 33.4% | 32.1% | 34.1% | 34.7% | 33.9% | 35.7% | 33.4% | 34.1% |
| Unpaid work > | 4.3% | 2.5% | 3.0% | 2.8% | 2.9% | 3.6% | 3.9% | 3.3% | 5.9% | 4.0% | 2.6% | 3.5% |
Notes:
- `A-` is my top-level category for child-care
Sleep over the years:
Sleep percentage
| Year | Jan | Feb | March | April | May | June | July | Aug | Sept | Oct | Nov | Dec |
| 2013 | 36.0% | 34.9% | 37.0% | 36.5% | 32.5% | 35.8% | 37.4% | 43.1% | 37.9% | 36.9% | 37.8% | 34.5% |
| 2014 | 36.4% | 38.2% | 37.0% | 36.7% | 35.0% | 37.6% | 37.8% | 34.7% | 36.1% | 34.3% | 41.3% | 37.4% |
| 2015 | 35.5% | 35.3% | 38.5% | 35.0% | 35.1% | 39.7% | 36.9% | 40.1% | 40.3% | 37.4% | 37.8% | 41.4% |
| 2016 | 35.5% | 35.3% | 38.5% | 35.0% | 35.1% | 39.7% | 36.9% | 40.1% | 40.3% | 37.4% | 37.8% | 41.4% |
| 2017 | 38.2% | 35.9% | 34.3% | 35.1% | 33.0% | 30.8% | 32.6% | 27.2% | 26.5% | 32.8% | 34.0% | 29.6% |
| 2018 | 29.7% | 33.4% | 32.8% | 32.5% | 31.0% | 29.3% | 35.1% | 33.0% | 37.7% | 36.9% | 29.3% | 34.0% |
| 2019 | 33.2% | 34.7% | 35.3% | 35.6% | 33.9% | 30.4% | 32.0% | 32.9% | 35.7% | 34.6% | 33.1% | 34.4% |
| 2020 | 32.8% | 34.7% | 37.9% | 32.2% | 32.8% | 30.3% | 31.5% | 30.1% | 32.4% | 31.8% | 28.9% | 33.1% |
| 2021 | 28.6% | 30.1% | 34.6% | 33.3% | 31.6% | 31.8% | 36.1% | 33.6% | 35.1% | 34.7% | 32.5% | 32.4% |
| 2022 | 35.5% | 35.6% | 38.5% | 37.2% | 38.1% | 38.4% | 36.5% | 38.1% | 35.3% | 32.0% | 30.1% | 27.8% |
| 2023 | 34.6% | 35.4% | 32.9% | 34.9% | 33.4% | 32.1% | 34.1% | 34.7% | 33.9% | 35.7% | 33.4% | 35.2% |
import numpy as np
import pandas as pd
import matplotlib.pyplot as plt
import seaborn as sns
df = pd.DataFrame(data[1:], columns=data[0]).set_index('Year')
df = df.applymap(lambda x: float(x.strip('%'))*24/100.0)
plt.title("sachac's sleep hours per day by month and year")
plot = sns.heatmap(df, annot=True, cmap='crest', fmt='.1f')
fig = plot.get_figure()
fig.savefig('sleep-time.png')
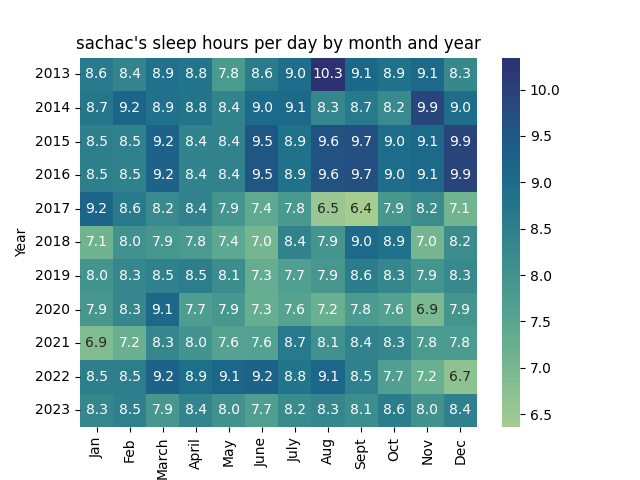
The kiddo was born in 2016. You can see how much less sleep I've been getting since then. =)
View or add comments (Disqus), or e-mail me at sacha@sachachua.com